

- Marcus Pietz CFA
- 08.06.2026
- 5 min read
Benchmarking
IRR Attribution Analysis
The Benchmarking section has been completely revamped with a simplified navigation setup and an updated design to help you find the most important information more quickly.
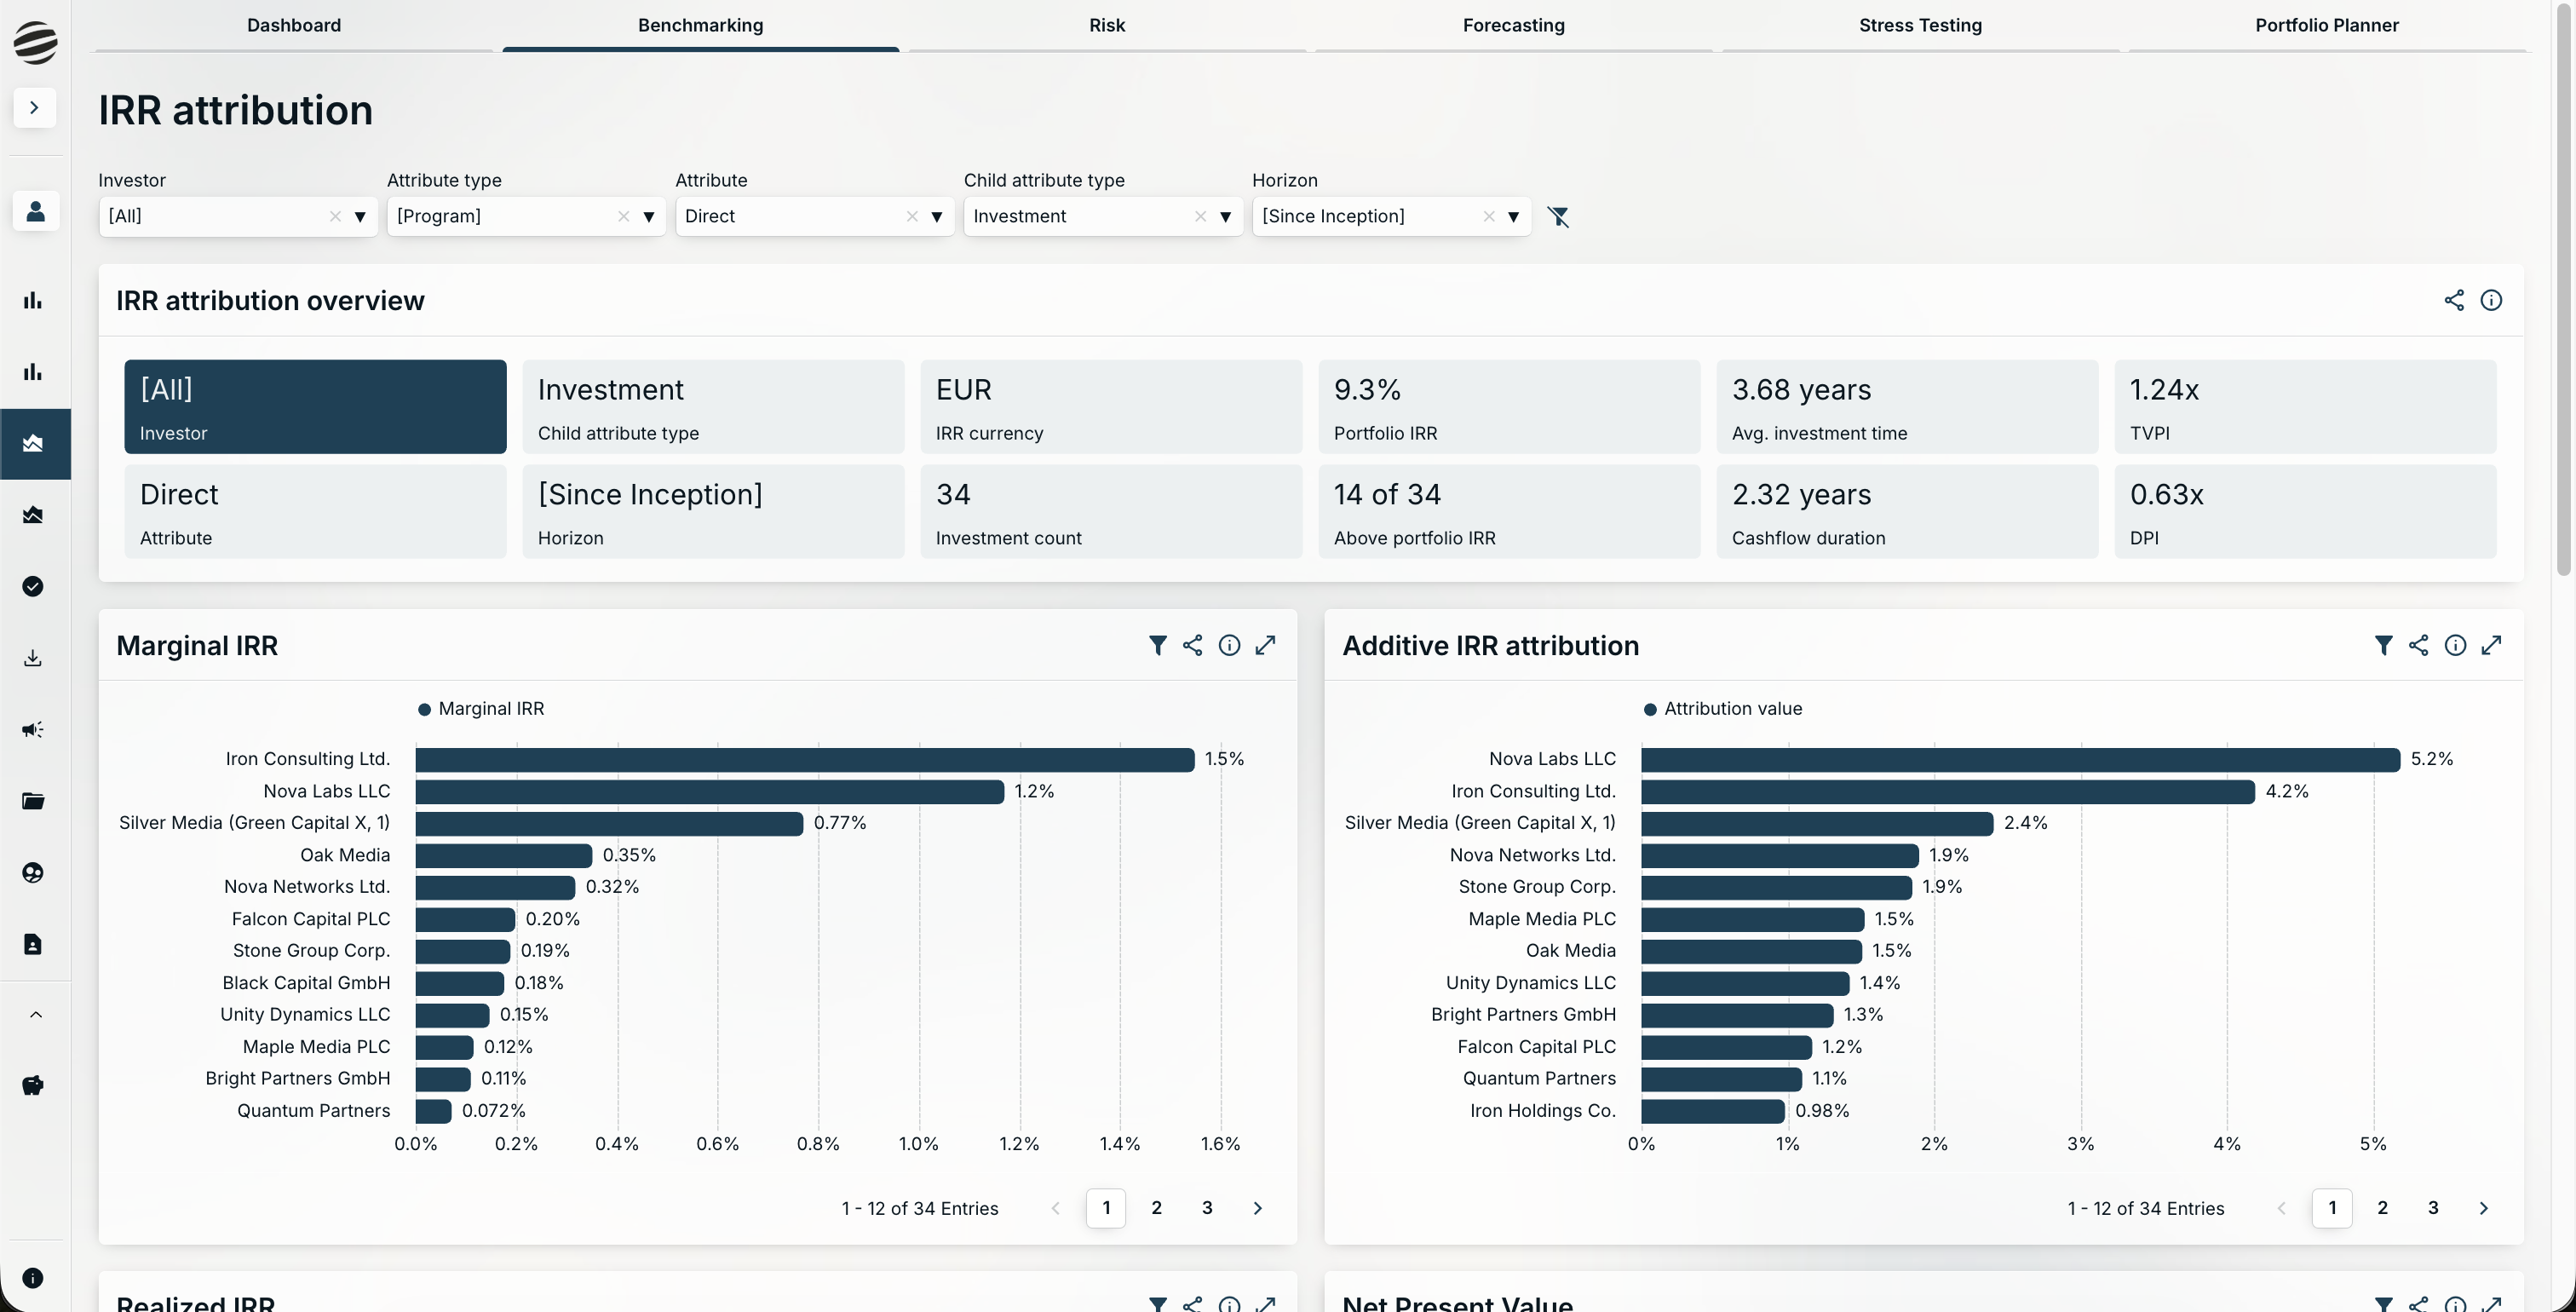
The headline addition is IRR Attribution Analysis. Rather than presenting aggregate IRR figures alone, the new analysis decomposes portfolio and fund-level IRRs into the individual contributions of each underlying investment. This makes it straightforward to identify which investments are genuinely driving performance and which are diluting it, without requiring manual calculation or external modelling.
What this means in practice:
Decompose aggregate IRRs into per-investment contributions
Identify true performance drivers at a glance
Streamlined navigation across the full benchmarking section
Refreshed layout with improved information hierarchy
Risk
Expected Shortfall and Cash Flow at Risk
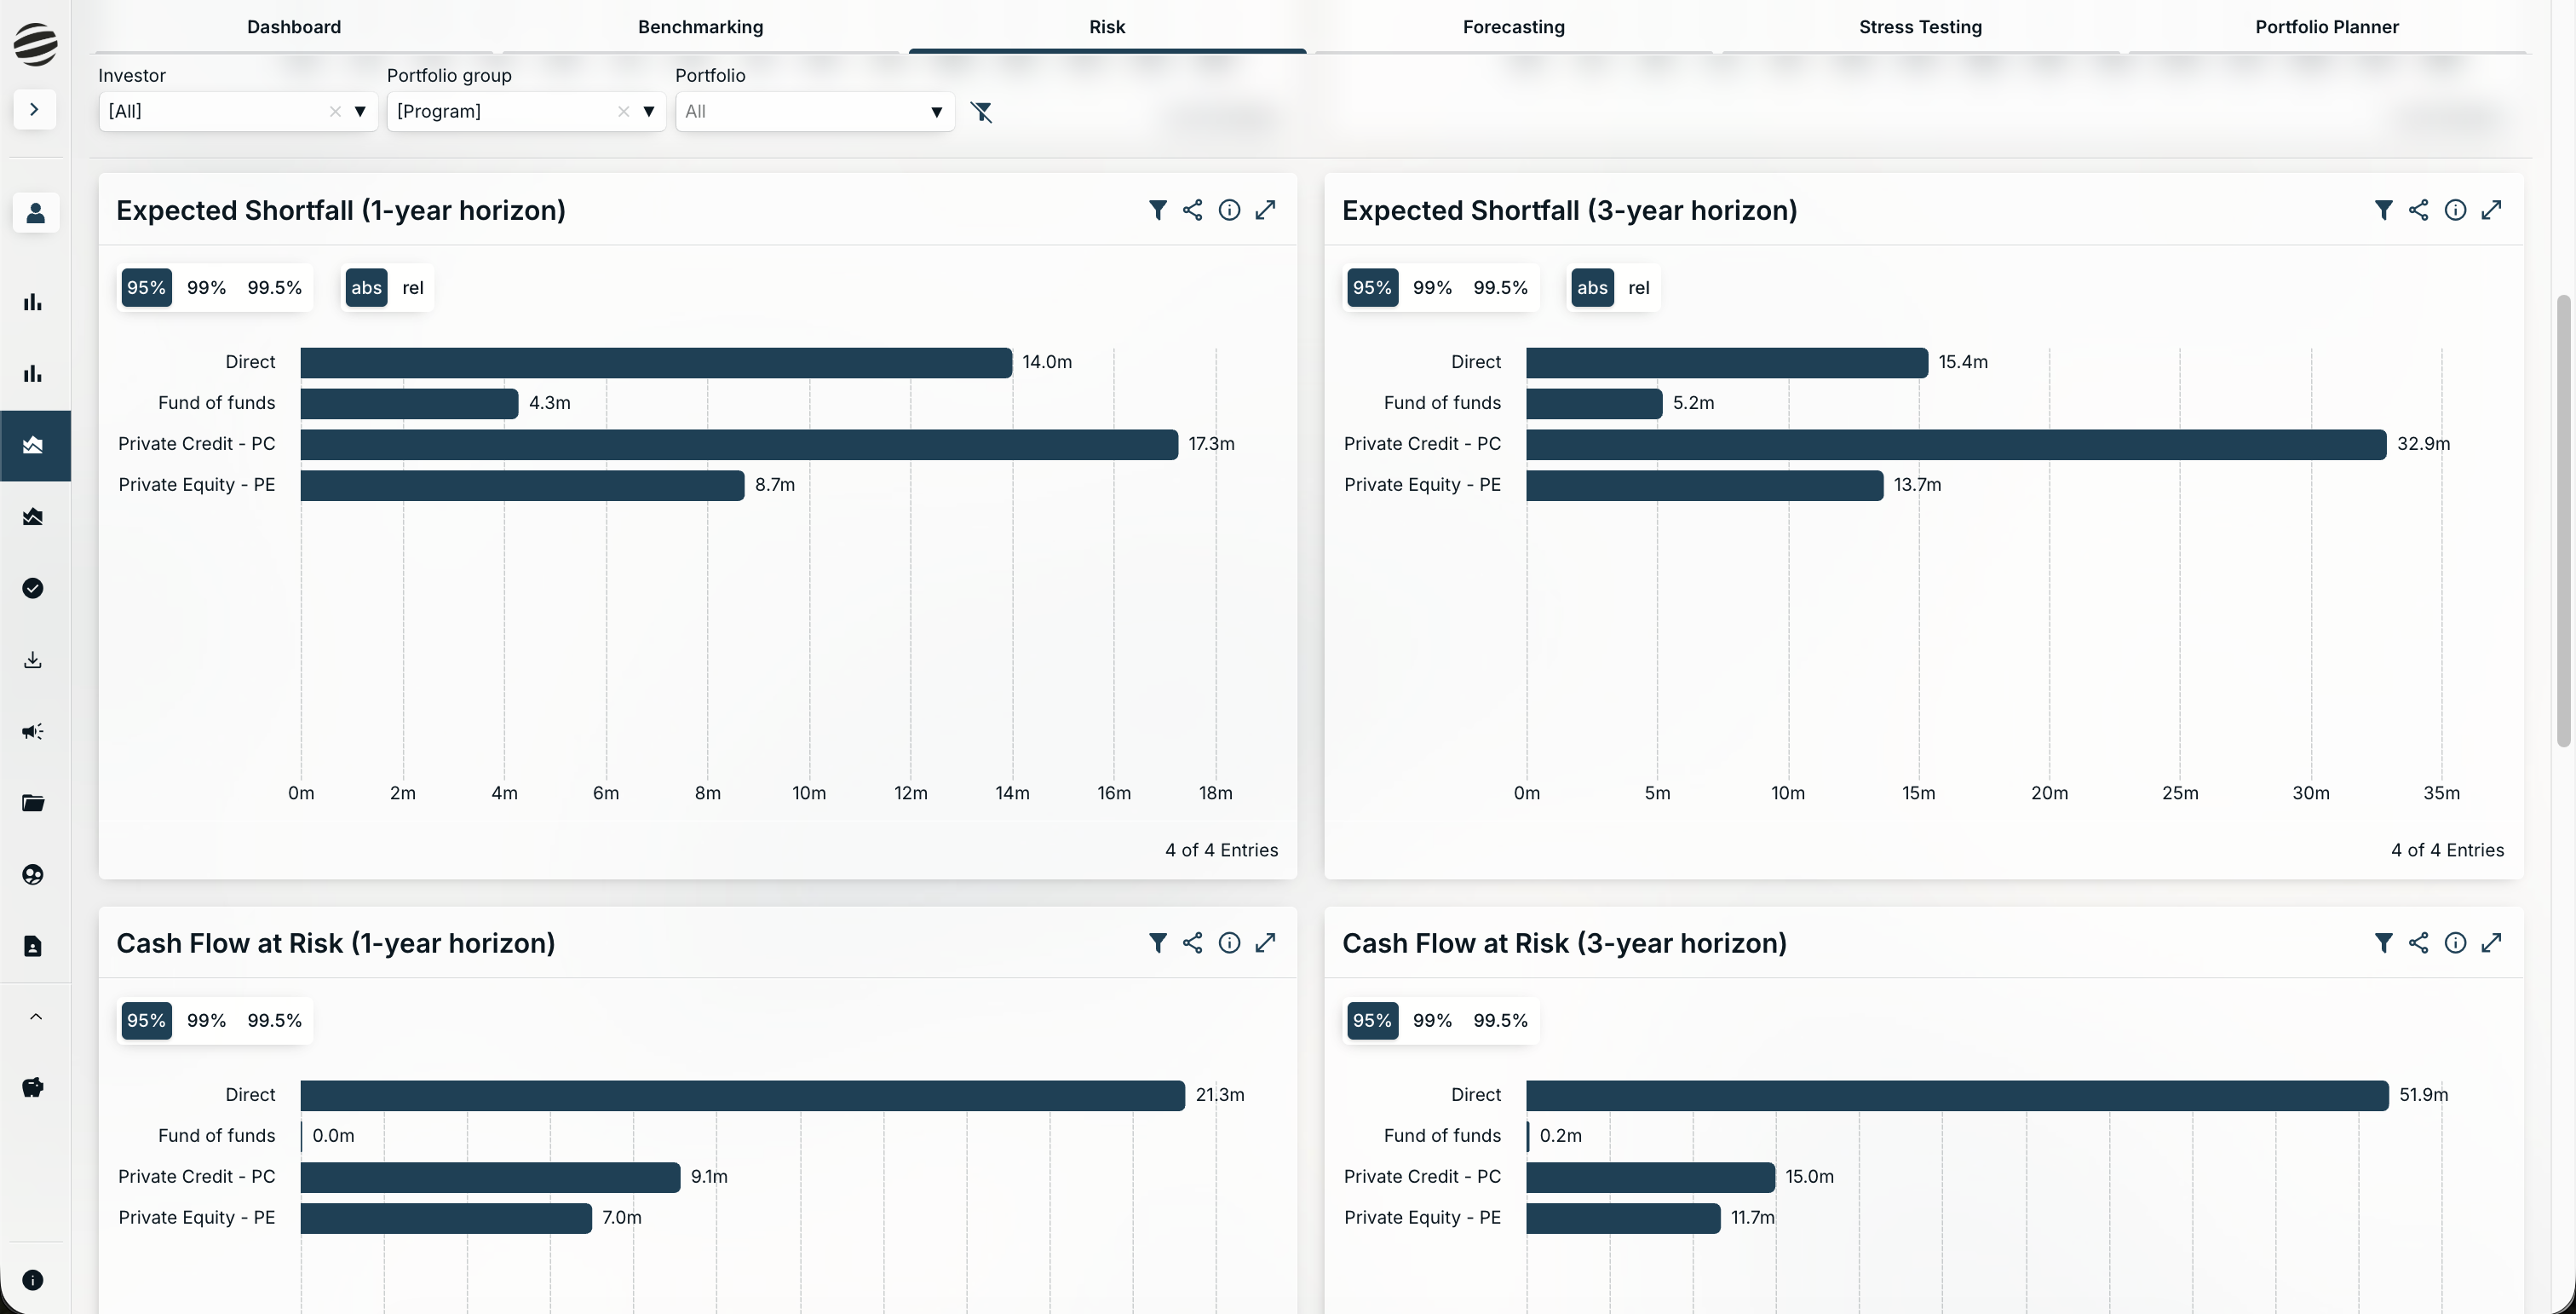
The Risk section now includes two new risk measures, which provide a deeper analysis than just using Value at Risk alone.
Expected Shortfall captures the average loss in the worst-case scenarios beyond the VaR threshold, giving a more complete picture of tail-risk exposure. Cash Flow at Risk quantifies the potential shortfall in projected cash flows under adverse conditions, a particularly relevant measure for LPs managing liquidity commitments and capital call obligations simultaneously.
Both new KPIs are supported by full sub-component analysis. Risk can be broken down and examined across any combination of investments, strategies, regions, and vintages, making it possible to identify exactly where concentration is building rather than observing it only at the aggregate level.
What this means in practice:
Expected Shortfall available as standard alongside VaR
Cash Flow at Risk for liquidity-focused risk assessment
Full sub-component analysis across investments, strategies, regions, and vintages
More granular understanding of where risk concentrates within the portfolio
Forecasting
New Dashboard and Value Tables
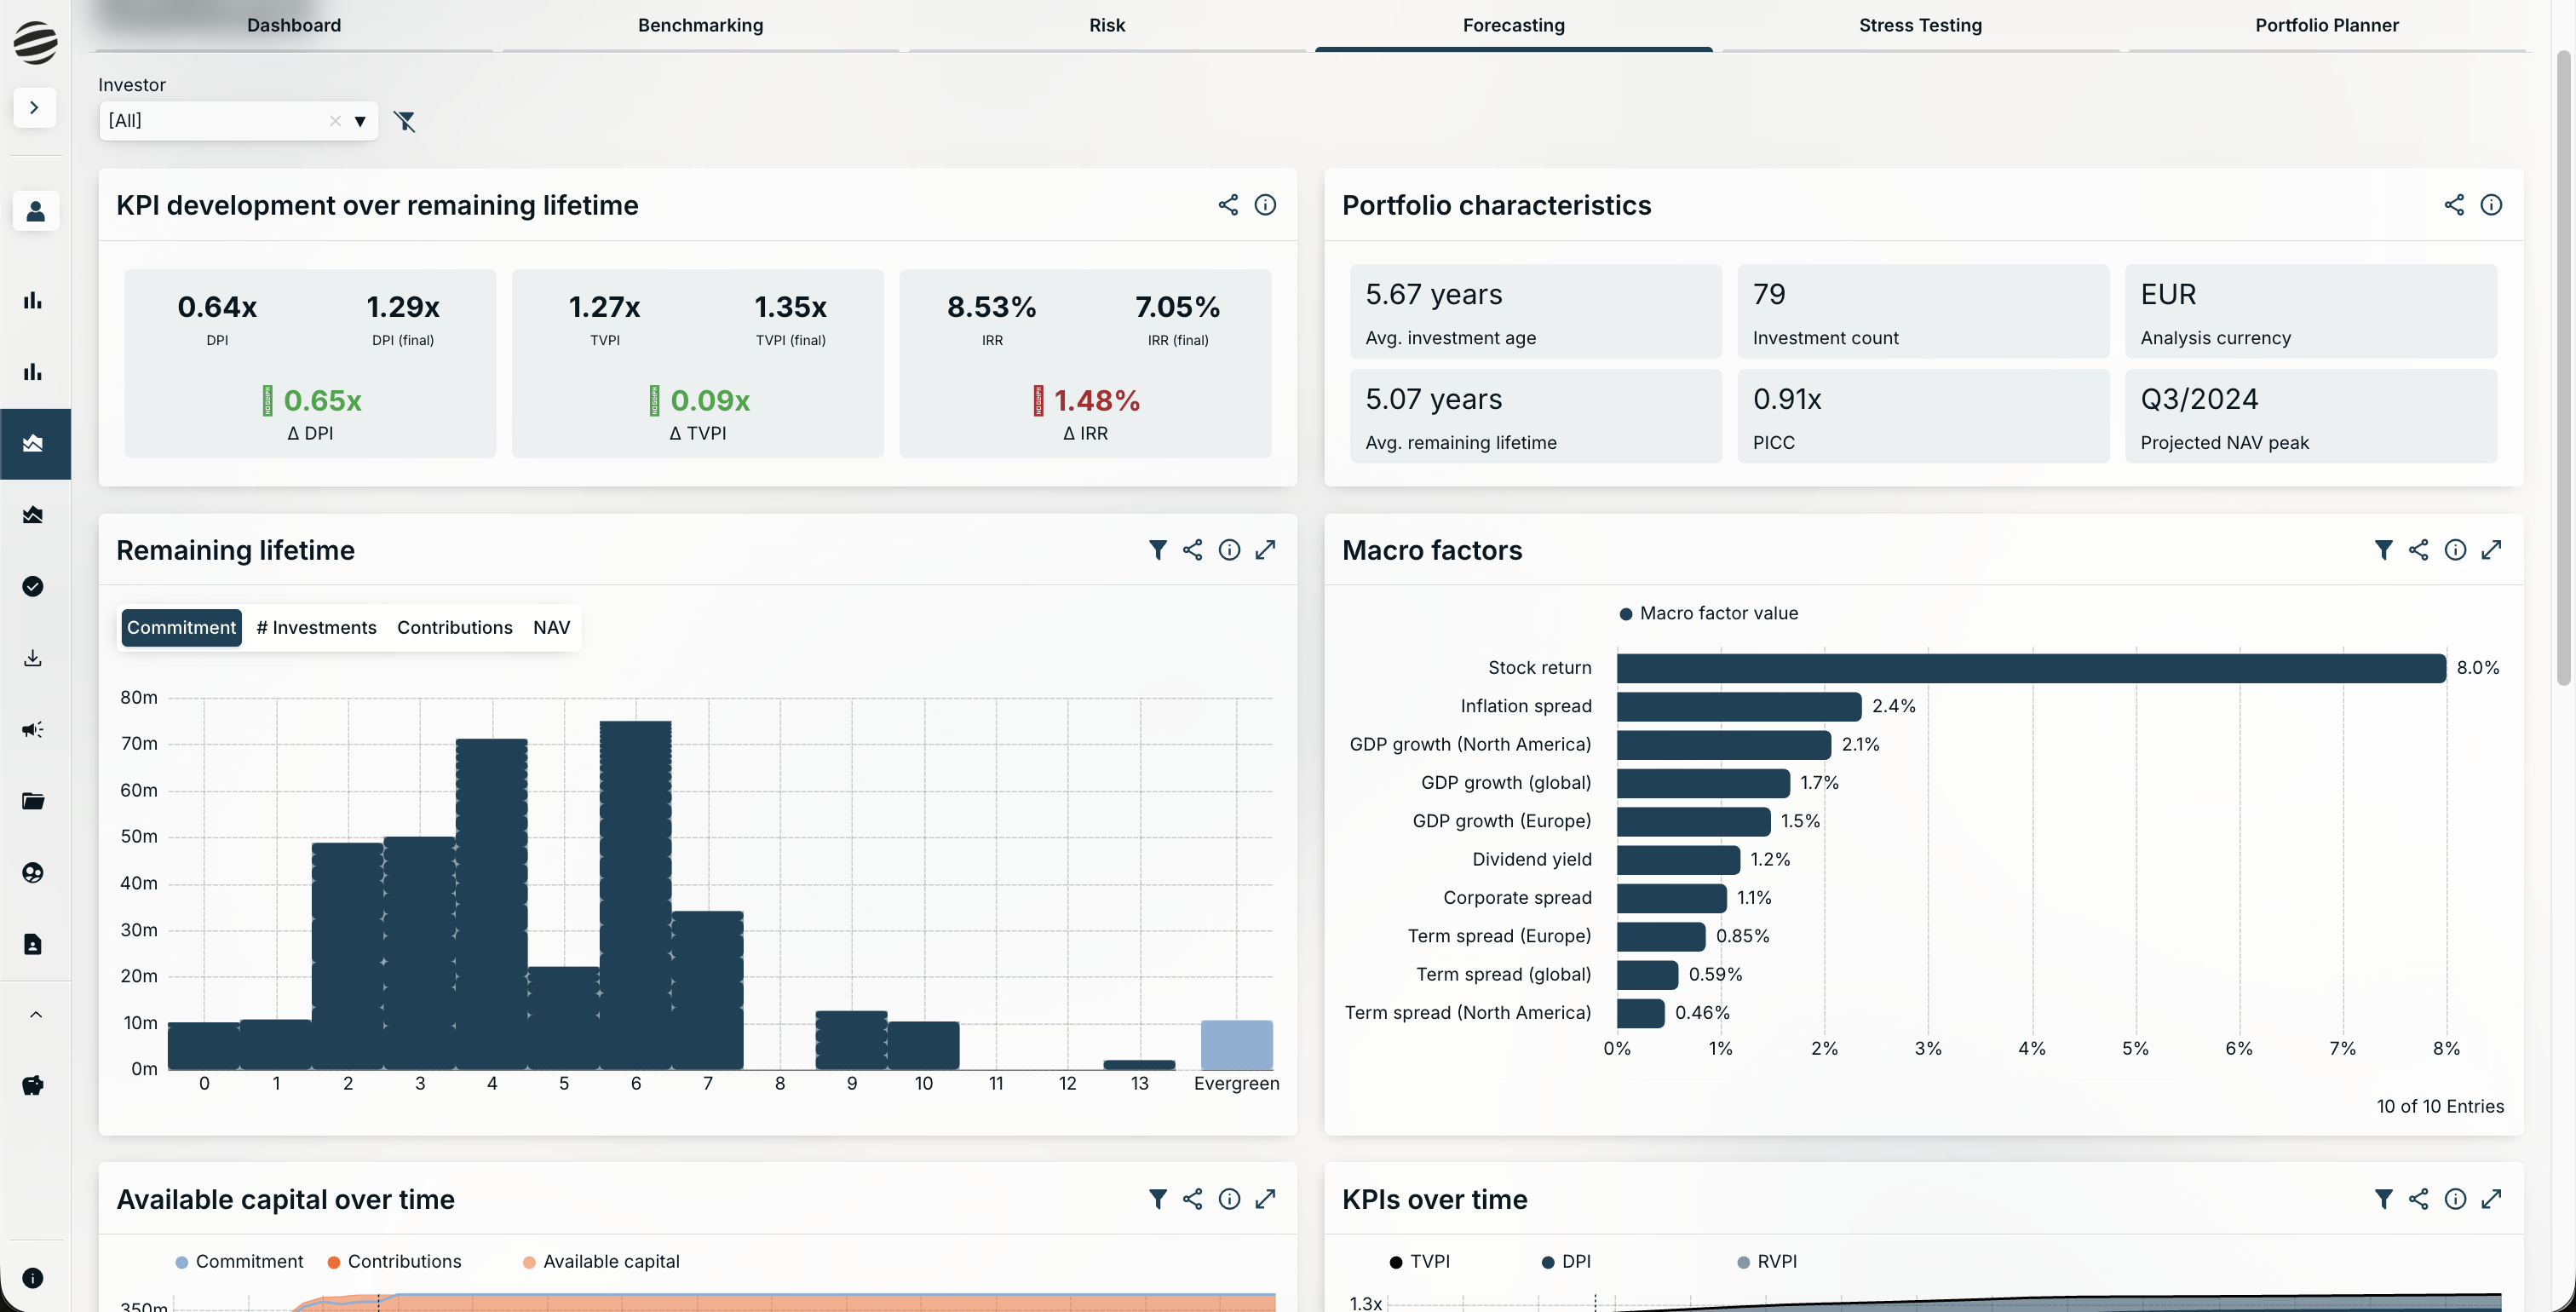
The Forecasting section has been rebuilt around a brand new overview dashboard. The dashboard brings together KPI developments, portfolio characteristics, remaining investment lifetimes, projected cash flows, and macro environment indicators into a single at-a-glance view. For teams that previously needed to navigate across multiple sub-pages to assemble a complete forecasting picture, this represents a significant reduction in time and effort.
Detailed value tables are now available on every sub-page within the Forecasting section. These tables provide granular, period-by-period projections for contributions, distributions, and net asset values, giving operations and investment teams the underlying data to interrogate and present cash flow forecasts with confidence.
What this means in practice:
New overview dashboard combining all key forecasting KPIs in one place
At-a-glance view of projected cash flows, portfolio characteristics, and macro environment
Detailed value tables on all sub-pages for period-by-period analysis
Contributions, distributions, and NAV projections all accessible from a single section
Portfolio Planner
Secondary Transaction Management
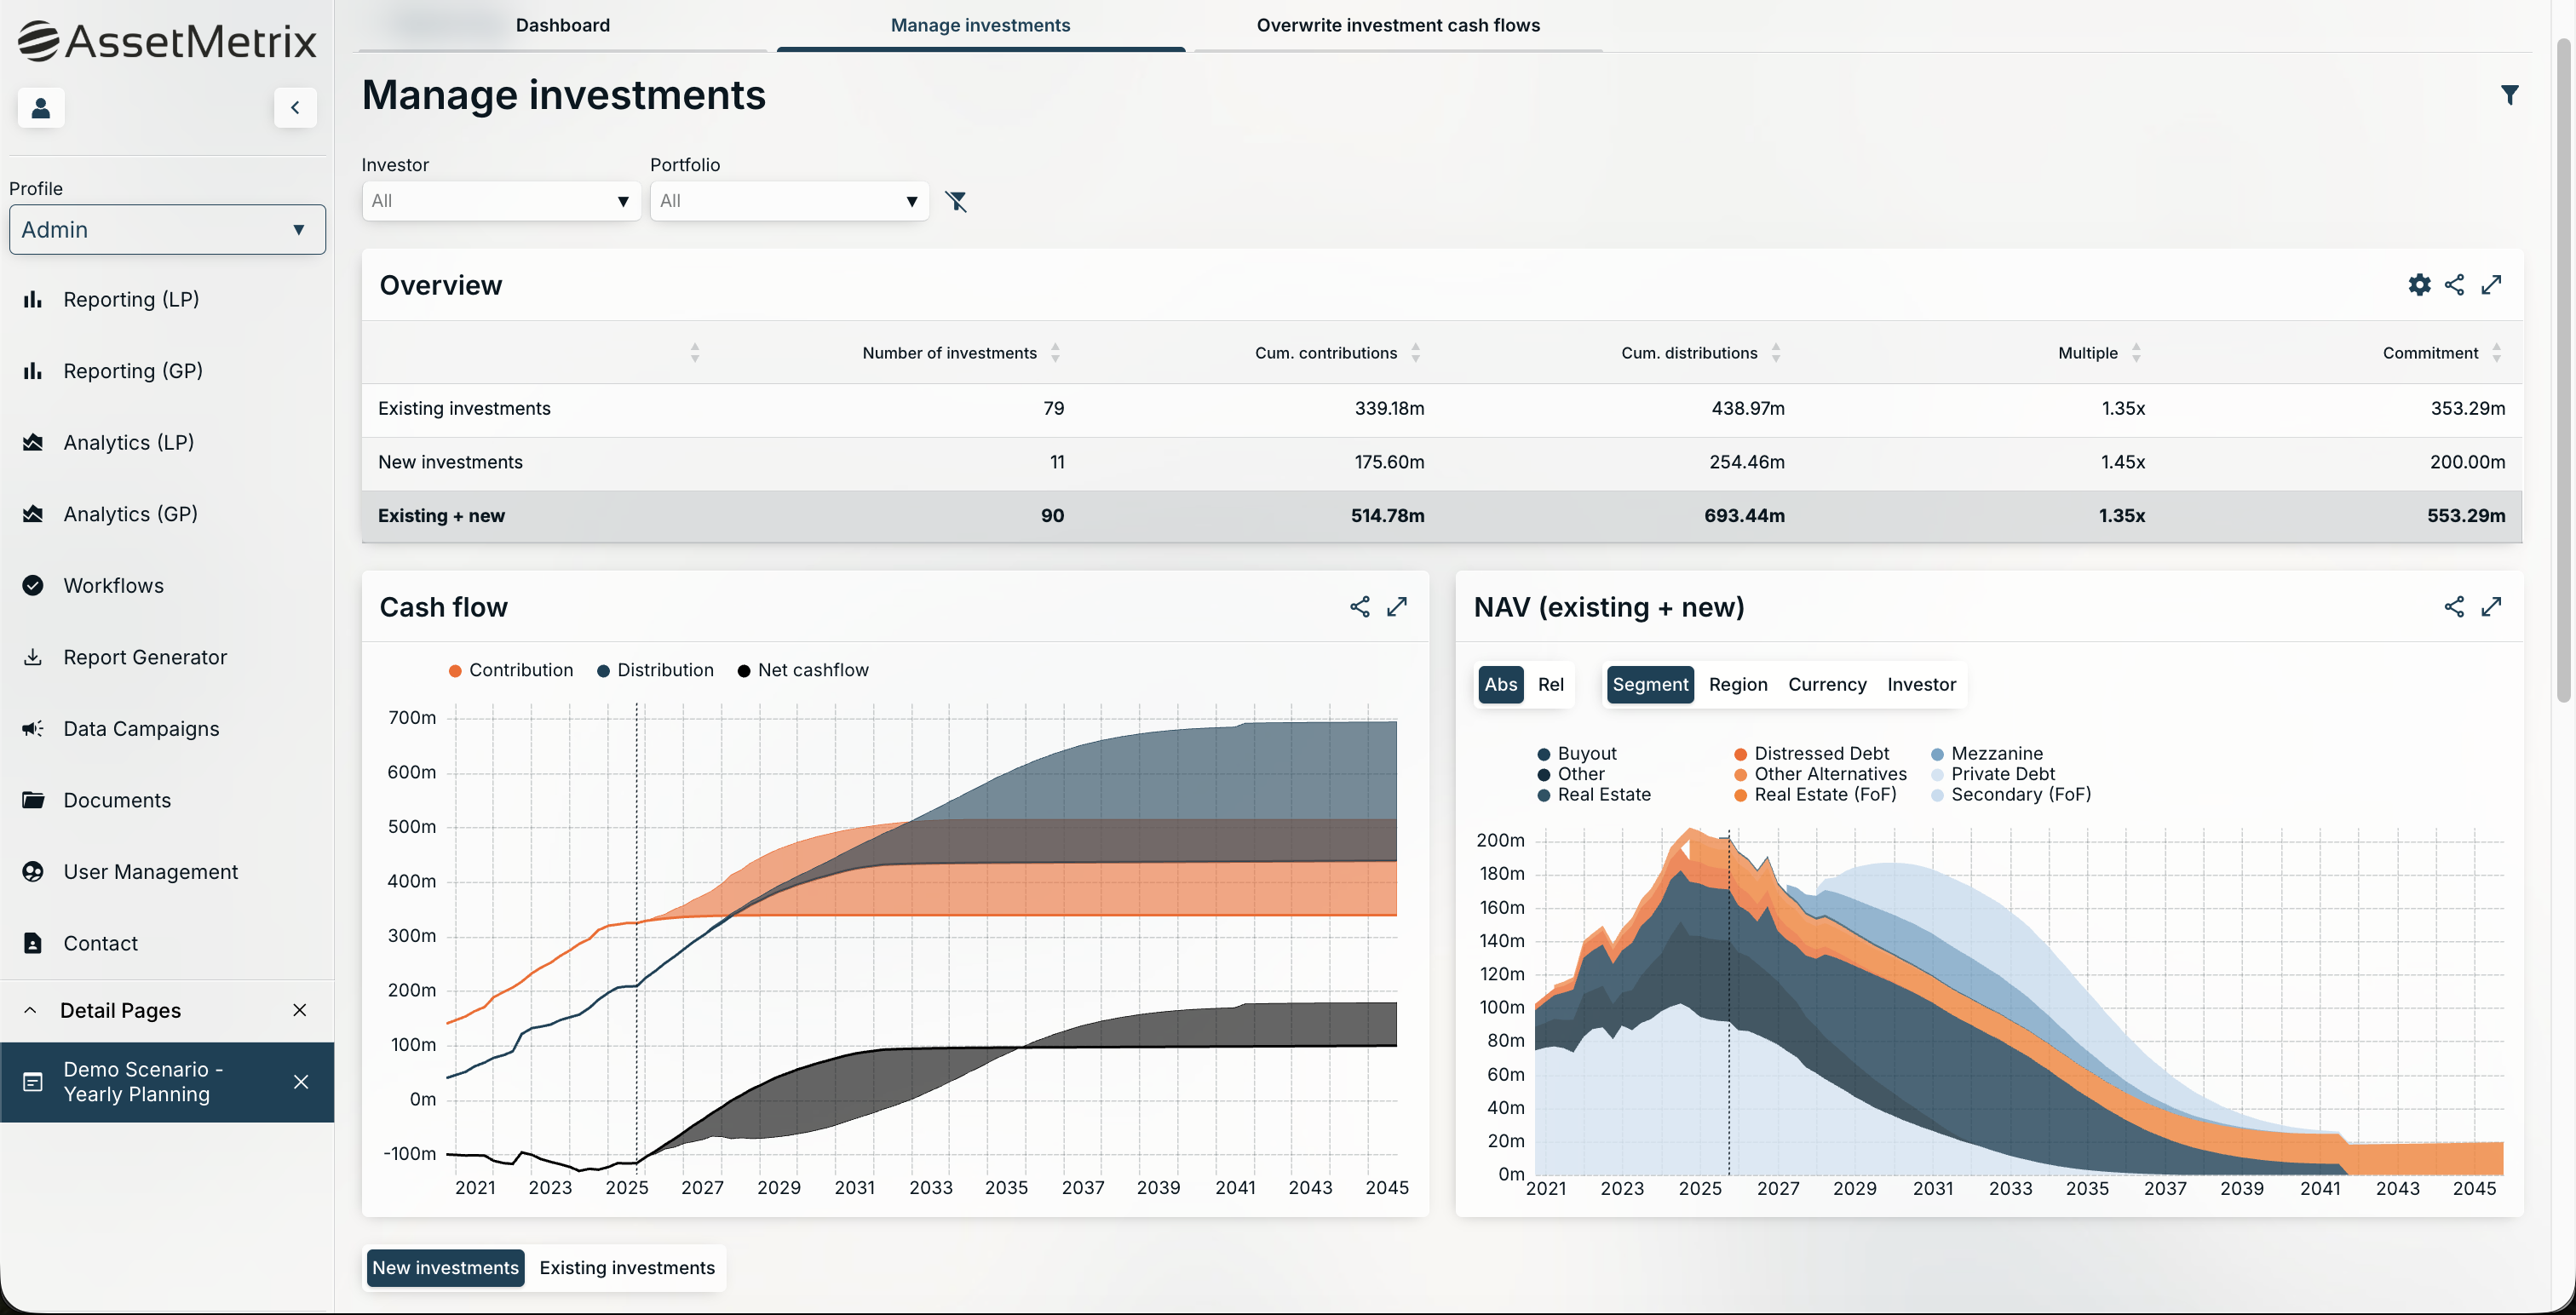
The Portfolio Planner has been updated to version 50, introducing secondary transaction management as a core capability. Secondary acquisition and sale events can now be modelled directly within the platform, across both the Manage Investments and Overwrite Investment Cash Flows screens.
Users can enter the amount as a positive or negative percentage of commitment basis, along with the timing of the transaction, and apply an optional secondary discount or premium to NAV. This removes the need to model secondary scenarios outside the platform and brings them into the same governed, auditable environment as all other planning activity.
Dynamic Filtering and Multi-Currency Support
Custom dynamic page filters have been added to the Dashboard and Manage Investments screens. Portfolios can now be sliced by any dimension relevant to the user, whether that is strategy, geography, vintage, or currency, without navigating away from the current view.
Multi-currency planning is now supported out of the box through a new investment currency attribute for new commitments. Teams managing portfolios across multiple currencies can plan directly in the relevant currency without additional configuration.
Enhanced Data Exports
Per-chart and per-table downloads are now available across the Portfolio Planner, alongside additional data points including amortised cost in full scenario exports.
What this means in practice:
Secondary acquisition and sale events modelled directly within the platform
Optional secondary discount or premium to NAV
Dynamic filtering by any portfolio dimension on Dashboard and Manage Investments screens
Multi-currency planning supported as standard
Enhanced exports with per-chart, per-table downloads and additional data points
Summary of Changes
Benchmarking - Full rework, new IRR Attribution Analysis
Risk - New Expected Shortfall and Cash Flow at Risk KPIs, full sub-component analysis
Forecasting - New overview dashboard, detailed value tables on all sub-pages
Portfolio Planner - Secondary transaction management, dynamic filtering, multi-currency support, enhanced exports
What This Release Means for Your Team
The firms managing private markets portfolios with confidence in 2026 are not the ones with the largest teams. They are the ones with the clearest picture of what they own, where their risk sits, and how their portfolio is likely to develop.
This release moves that bar. IRR attribution that shows you what is actually driving performance. Risk measures that go beyond the headline number. A forecasting experience that brings everything into one place. Secondary transaction modelling that belongs inside your governed platform, not a spreadsheet sitting outside it.
Every capability in this release was shaped by direct client feedback and the operational reality of running institutional private markets portfolios at scale. That is how we build, and it is why the platform keeps moving forward.
If you are not yet an AssetMetrix client and want to see what this looks like in practice, we would like to show you.